Chapter 10 Regression Analysis And Confounders
Key concepts: partial effect, statistically controlling for effects of other predictors, indirect correlation, confounders, suppression and suppressor, spuriousness and reinforcer.
Watch this micro lecture on confounders for an overview of the chapter.
Summary
If we analyze the effects of two or more predictors on a dependent variable in a regression model, the effect of a predictor is adjusted for the effects of other predictors. Each predictor only predicts the part of the scores on the dependent variable that cannot be predicted by the other predictors. If we predict newspaper reading time, for example, from age and interest in politics, age predicts the part of newspaper reading time that interest in politics cannot predict.
Because the effects of predictors are adjusted for the effects of other predictors, the effects of predictors may change if a new predictor is added to a regression model. The effects can become stronger (the new variable was a suppressor) or weaker and even change direction (the new variable was a reinforcer). For example, adding respondents’ news site use to the regression model predicting newspaper reading time from age may change the effect of age on newspaper reading time.
Indirect correlations play a central role here: the correlation between a predictor (age) and the dependent variable (newspaper reading time) due to a third variable (news site use) that is correlated both with the predictor and the dependent variable. The size of the indirect correlation is the product of the correlation between the predictor (age) and third variable (news site use) and the correlation between the third variable (news site use) and the dependent variable (newspaper reading time).
Essential Analytics
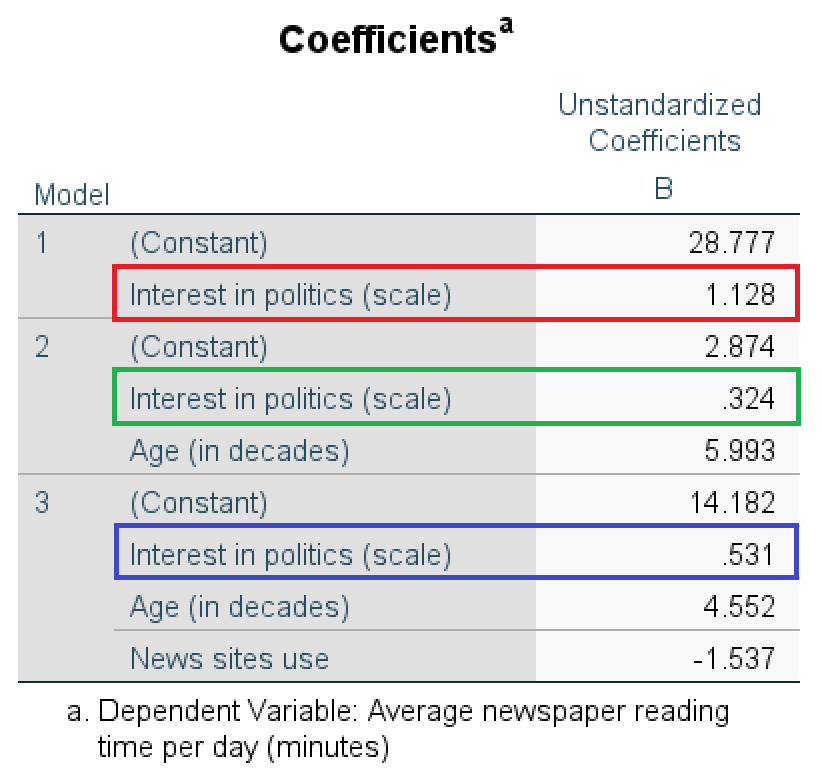
We can detect confounders by adding each independent variable as a separate Block in a linear regression model (the Linear option in the Regression submenu). The SPSS output estimates a regression model for each block (Figure 10.1).

Figure 10.1: SPSS table of regression models with the independent variables interest in politics, age, and news site use added one by one.
In the first model, interest in politics is the only predictor. One additional unit of interest in politics adds 1.13 to the predicted newspaper time per day (Figure 10.1, red box). If age is added as a predictor in the second model, the effect of interest in politics decreases from 1.13 to 0.32 (Figure 10.1, green box). Age reinforced the effect of interest in politics in the first model. The third model adds the predictor variable news site use. Now, the effect of interest in politics increases from 0.32 to 0.53 (Figure 10.1, blue box); news site use suppressed the effect of interest in politics in the second model.