4.5 Statistical test selection

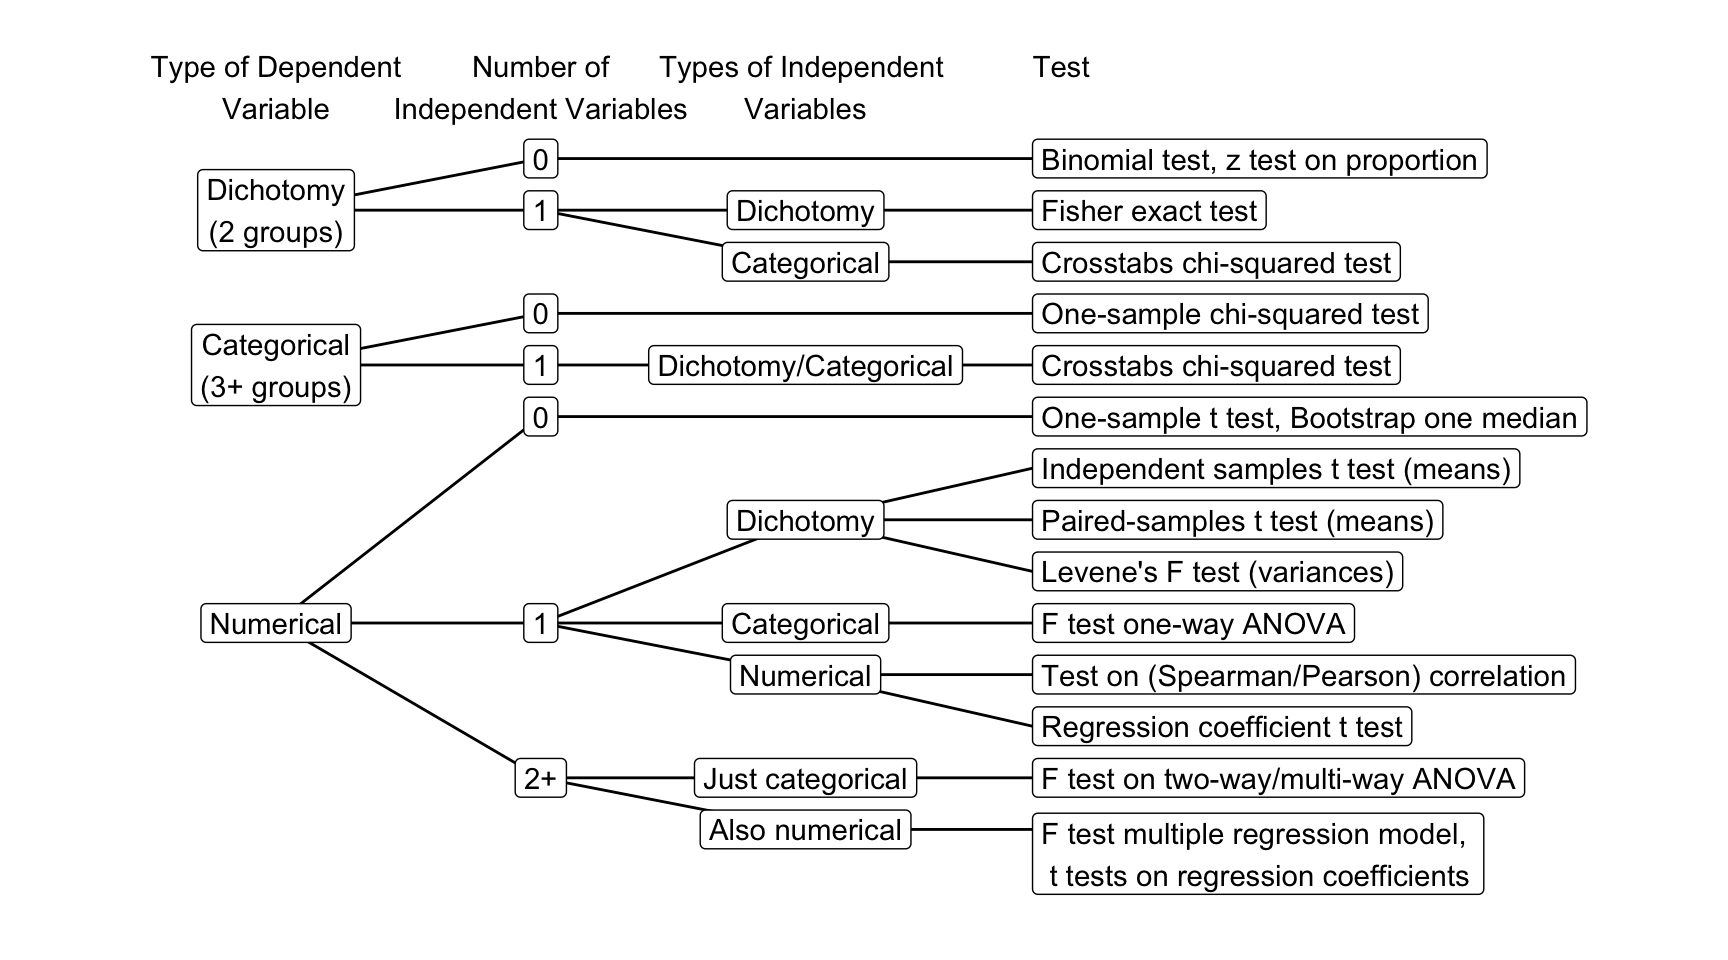
Figure 4.21: Flow chart for selecting a test in SPSS.
Statistics such as means, proportions, variances, and correlations are calculated on variables. For translating a research hypothesis into a statistical hypothesis, the researcher has to recognize the dependent and independent variables addressed by the research hypothesis and their variable types. The main distinction is between dichotomies (two groups), (other) categorical variables (three or more groups), and numerical variables. Once you have identified the variables, the flow chart in Figure 4.21 helps you to identify the right statistical test.
If possible, SPSS uses a theoretical probability distribution to approximate the sampling distribution. It will select the appropriate sampling distribution. In some cases, such as a test on a contingency table with two rows and two columns, SPSS automatically includes an exact test because the theoretical approximation cannot be relied on.
SPSS does not allow the user to specify the null hypothesis of a test if the test involves two or more variables. If you cannot specify the null hypothesis, SPSS uses the nil hypothesis that the population value of interest is zero. For example, SPSS tests the null hypothesis that males and females have the same average willingness to donate to a charity, that is, the mean difference is zero, if we apply an independent samples t test.
Imagine that we know from previous research that females tend to score one point higher on the willingness scale than males. It would not be very interesting to reject the nil hypothesis. Instead, we would like to test the null hypothesis that the average difference between females and males is 1.00. We cannot change the null hypothesis of a t test in SPSS, but we can use the confidence interval to test this null hypothesis as explained in Section ??.